
Market Backdrop
U.S. equity markets enter 2026 with a setup that has historically created compelling opportunities for disciplined investors. Leadership within U.S. equities remains narrow and expensive, dominated by large-cap growth stocks trading at elevated valuation multiples. In contrast, small-cap equities offer historically attractive valuations and a favorable setup for potential outperformance.
Today, the ten largest companies by market capitalization make up more than 40% of the S&P 500 Index (S&P 500). These stocks are not only dominant, but also expensive, trading at much higher valuations than the rest of the market. By comparison, the other 490 companies in the index trade at significantly lower prices relative to their earnings.
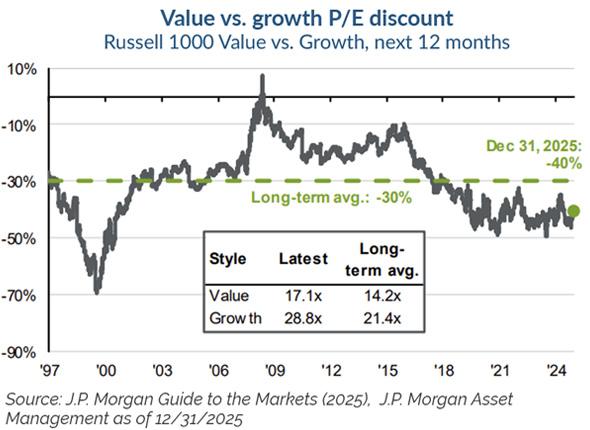
Valuation gaps between value and growth, as well as between small caps and large caps, remain near their widest levels in decades. Value stocks, as represented by the Russell 1000 Value Index, are trading at meaningfully lower prices relative to their earnings than growth stocks, represented by the Russell 1000 Growth Index. Value stocks currently trade at about 17 times expected earnings, compared with 29 times for growth stocks, a roughly 40% discount. This means investors are paying much less for each dollar of earnings in value stocks than in growth stocks, one of the largest discounts since the early 2000s.
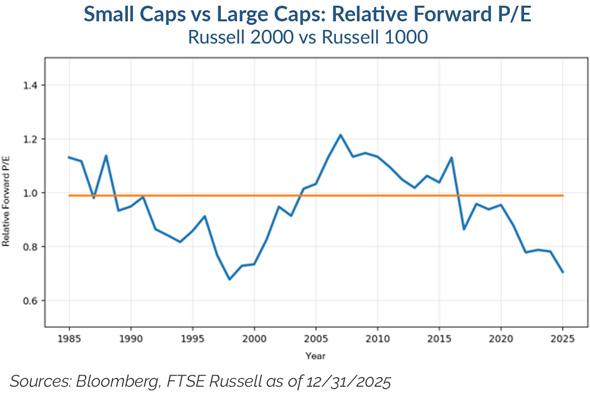
Similarly, small cap stocks, represented by the Russell 2000 Index, are trading at substantial discounts relative to large cap stocks, represented by the Russell 1000 Index. This includes a roughly 30% discount on forward price-to-earnings, which compares a company’s stock price to its expected future profit, a 57% discount on price-to-book, which measures a company’s market value to the value of its assets, and a 44% discount on enterprise value to free cash flow, which looks at how much investors are paying for the cash a business generates after expenses (see chart below).
Together, these valuation gaps underscore the breadth of opportunity within the small-cap universe.
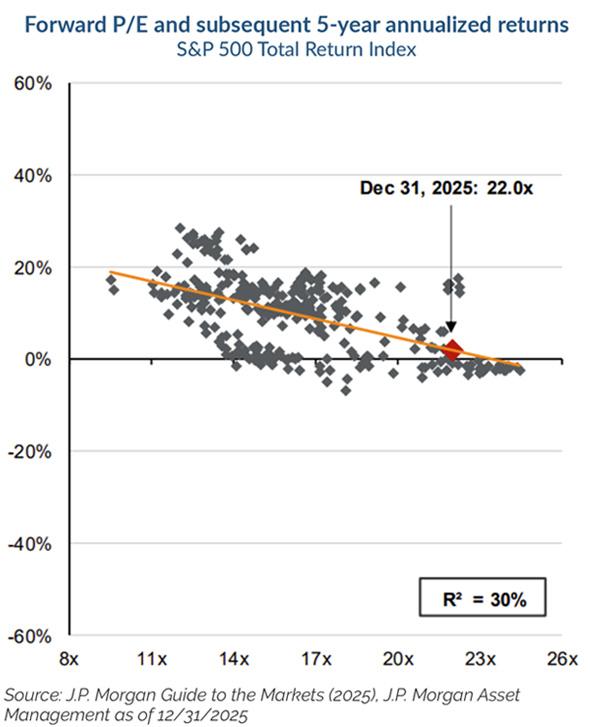
The current market environment bears resemblance to the late 1990s in terms of this growth-to-value, large-to-small disparity. We anticipate mean reversion in the price/earnings multiples commanded by large-cap and artificial intelligence-related stocks relative to small-cap value, although we acknowledge this process can unfold gradually. In our late-1990s analogy, this took approximately two years to fully inflect but ultimately lasted over seven years. With the S&P 500 trading at 22 times forward earnings amid historically narrow market leadership, we believe this presents an actionable opportunity for small-cap value equities today, offering higher forward return potential with lower embedded expectations and the balance of potential gains versus risks is more favorable. JPMorgan Chase & Co. notes forward five-year annualized S&P 500 total returns are quite low when past multiples have been this high (see chart below).
Concentration risk remains a challenge for large-cap growth investors as index leaders are priced for near-perfection and require elite execution to meet already high embedded expectations, with little margin for error. The catalyst for the re-rating in valuation will be multi-faceted, but it should occur as investors realign their future cash flow expectations with reported earnings. We expect the difference between expectations and reality will be disappointing.
With small-cap value equities generally overlooked by market participants for over a decade, we view the lack of attention to the asset class as a prime opportunity to identify mispricing and drive sustained outperformance over the next number of years. The exploitable market inefficiencies are pronounced in the small-cap space, where limited capital and sell-side analyst coverage enable our team to find mispriced opportunities with asymmetric risk/reward profiles.
With small-cap value equities generally overlooked by market participants for over a decade, we view the lack of attention to the asset class as a prime opportunity to identify mispricing and drive sustained outperformance over the next number of years.
2026 Market Dynamics
Monetary and fiscal policy dynamics are increasingly constructive for small-cap value. We expect additional interest rate cuts through 2026, although the market currently is not pricing these in until early second-quarter of 2026. Cuts could arrive sooner as leading economic indicators continue to weaken. Labor markets are likely to remain the primary driver of policy decisions, as the U.S. Federal Reserve Board (Fed) responds to layoffs and weakening employment conditions, with the goal of accelerating economic growth. Inflation has become a secondary issue for the Fed relative to jobs, and we believe fears of re-accelerating inflation are largely overblown as inflation has moderated.
Looking ahead, with Fed Chair Jerome Powell’s term expiring in May, we expect a Trump-appointed successor to pursue a more stimulative monetary policy overall. This shift may lead to a steepening yield curve, with the long end rising on expectations of higher growth and investor hesitancy to purchase long-term paper given the fiscal deficit and debt imbalances. We are closely watching this dynamic as it may prove challenging for mortgages. Notably, the Fed has recently resumed quantitative easing (QE), purchasing assets to help the cash markets. It is possible the Fed may extend these plans to mortgage-backed securities or 10-year Treasuries to lower mortgage rates, a potentially significant development that remains underdiscussed. This drift back toward the post-credit crisis QE playbook should be positive for the U.S. economy and risk assets in the near term.
Tax and trade measures enacted or extended by the current U.S. administration are expected to increasingly flow through to the real economy in 2026, disproportionately benefiting domestically focused small-cap value companies. We are also monitoring a U.S. Supreme Court case regarding the constitutionality of certain tariffs, which could introduce additional volatility in select industries.
Taken together, these dynamics favor many of the end markets and companies represented across our portfolio. Financials stand to benefit from a steepening yield curve, while Industrials, Materials, and Information Technology companies are well positioned for ongoing onshoring initiatives. Consumer Discretionary companies may benefit from a resilient U.S. consumer, and the Health Care sector has become an increasingly attractive area as demographic trends and policy developments create new opportunities.
As long-tenured contrarians, we maintain a cautious view of consensus sell-side forecasts and public sentiment, which appear to be generally positive. Geopolitical uncertainty remains elevated abroad while domestically, the current U.S. administration has shown a penchant for maneuvering outside of established norms.
Somewhat concerning is the proliferation of private credit. The recent emergence of fraud and credit deterioration has caused trouble for many investors and financial institutions. We are looking at this area of the market with great interest to make sure spillover effects stemming from lending and underwriting by non-expert participants are contained and manageable.
Encouragingly, we have begun to see instances of asset flows rotating back into value, and small-cap value equities specifically. We expect this to be an additional tailwind that supports small-cap value over the intermediate term, and we view today’s setup as the opportune time for small-cap active value exposure. Forces that have worked against small-cap value and active management for the last decade now represent a material go-forward opportunity. Specifically, fewer active participants and increased correlations across index constituents are providing even more avenues for our established process to identify mispricing and drive meaningful risk-adjusted returns.
Forces that have worked against small-cap value and active management for the last decade now represent a material go-forward opportunity.
RISKS & DISCLOSURES
Investors should carefully consider the investment objectives, risks, charges and expenses of the Fund. This and other important information about the Fund is contained in the prospectus which should be read carefully before investing. To obtain a prospectus or summary prospectus which contains this and other information, visit funds.easterlyam.com or call Easterly Securities LLC at 888-814-8180. Performance data quoted represents past performance. Past performance is not indicative of future results. The investment return and principal value of an investment will fluctuate so that an investor’s shares, when redeemed, may be worth more or less than their original cost. Current performance may be lower or higher than the performance data quoted. All results are historical and assume the reinvestment of dividends and capital gains. Performance shown reflects contractual fee waivers. Without such waivers, total returns would be reduced. Please click here to view standardized performance for the Fund.
The Easterly funds are distributed by Easterly Securities LLC, member FINRA/SIPC. Easterly Investment Partners LLC is an affiliate of Easterly Securities LLC. Orange Investment Advisers, LLC and EAB Investment Group, LLC are not affiliated with Easterly Securities LLC.
Easterly Snow, Easterly Murphy, Easterly Ranger and Easterly ROC Municipals are investment teams of Easterly Investment Partners LLC, an SEC-registered investment adviser. EAB Investment Group LLC (d/b/a Easterly EAB), Orange Investment Advisors LLC (d/b/a Easterly Orange), and Lateral Investment Management are separate SEC-registered investment advisers that are strategic partners of Easterly. Each investment adviser’s Form ADV is available at www.sec.gov. Registration does not imply and should not be interpreted to imply any particular level of skill or expertise.
Not FDIC Insured–No Bank Guarantee–May Lose Value.
IMPORTANT FUND RISK
There is no assurance that the Fund will achieve its investment objectives. The Fund share price will fluctuate with changes in the market value of its portfolio investments. When you sell your Fund shares, they may be worth less than what you paid for them and, accordingly, you can lose money investing in this Fund. Investments in Small- and Medium-capitalization companies tend to have limited liquidity and greater price volatility than large-capitalization companies. Diversification does not assure a profit nor protect against loss in a declining market. Investments in foreign securities involve greater volatility and political, economic and currency risks and differences in accounting methods. These risks are greater in emerging markets. Investments in debt securities typically decrease in value when interest rates rise. This risk is usually greater for longer-term debt securities. The fund may invest in lower-rated and non-rated securities which present a greater risk of loss to principal and interest than higher-rated securities. The fund may invest in other investment companies, and the cost of investing in the Fund will generally be higher than the cost of investing directly in the shares of the mutual funds in which it invests. By investing in the Fund, you will indirectly bear your share of any fees and expenses charged by the underlying funds, in addition to indirectly bearing the principal risks of the funds. The Fund may use options and futures contracts which have the risks of unlimited losses of the underlying holdings due to unanticipated market movements and failure to correctly predict the direction of the securities prices, interest rates and currency exchange rates. This investment may not be suitable for all investors.
20260120_5139678